Company’s Profile and Objective
Our client is in the Pharmaceutical and Wellness Retail chain with branches spread across India in all the major cities and towns. Apart from the medicinal drugs, they sell FMCG products for wellness and personal hygiene. They sell genuine medicines and healthcare products round the clock through brick-and-mortar stores, their website, and their mobile app.
The pharma company has been bestowed with various awards. Some of them include the best omnichannel retailer and the most admired retailer in the healthcare & beauty segment, apart from excellence in pharmacy. With their expanding network among hospitals and customers, they faced the challenge of aptly marketing their offerings at the right time.
As a fast-growing company, they wanted to promote their FMCG products in bundles both in-store and online. The vision was to increase revenue, offer discounts that invite customers, and promote products together to increase sales. For this, they wanted to sell products in groups of 2 to 4.
This market basket analysis with the colossal data was a tricky question to solve and then our Logesys team was roped in. And challenges weren’t fewer.
Challenges
Massive Data
With their expanse in India and the size of their rapidly growing business, they faced the challenge of sifting through their massive historical data. With data as bulky as 20 million records for only 2 quarters, without a proper system in place, product bundling for promotions was a herculean task.
No Readymade Solution
Also, with a regular data warehousing and business intelligence solution, this was a near-impossible task to predict what combination of products would sell better.
Performance Issues
Although existing technologies in data science can handle huge data, performance was unpredictable, had we used some off-the-shelf solution.
Solution
The pharma giant didn’t have any existing system in place. The company’s marketing executives were using their expertise, experience, and manual analysis. They topped this analysis with their hunch for the bundled promotions.
Our tech team at Logesys analyzed the existing system that included SQL Server as their database and proposed the following tools and technologies to design the solution:
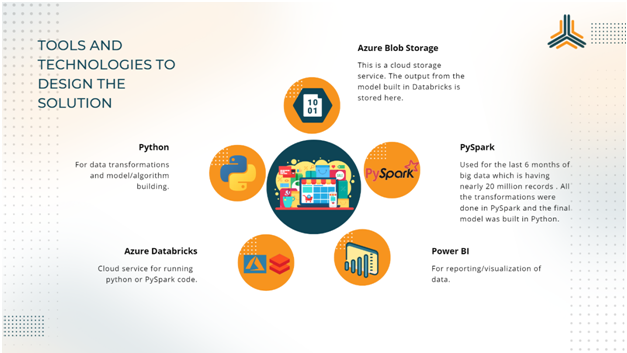
Instead of using an existing Python solution, our team amended the libraries and created a refined machine-learning solution to analyze the latest data and produce recommendations.
Data Processing
The highlight of this project is using PySpark with efficiency.
Although the usual process to create ML models is using Python, we suggested using PySpark, which would speed up the data preprocessing. PySpark is the Python API for Apache Spark that preprocesses the data by diving it into nodes in Azure Databricks. This did the heavy lifting of data preprocessing for the huge datasets by targeting the nodes simultaneously and running the code. Hence, increased the speed by 10 folds.
We have considered the last 6 months data for this project. Every time the client’s marketing executives analyze the market basket; they receive suggestions based on the last 6 months of products’ sales.
Data Cleansing
We cleansed the data to eliminate null values and invalid item codes. This helps pull the right records and club the products that aren’t invalid, expired, nonexistent, or out of stock.
Association Rules
Apriori, a popular and accurate association rule algorithm designed in Python, is used for market basket analysis. It sifts through the datasets to find association rules and figures out sets of products sold together earlier. It suggests products in pairs and triads.
Dashboard
The solution generates a Power BI report for the clients marketing team by pulling data from a table. This powerful business intelligence tool by Microsoft is known to have high performance and is robust to run analysis on large volumes of data. Power BI reports come with multiple features best suited for large datasets.
The dashboard analyzes products sold together based on their previous billed amount and frequency. The report shows the confidence with which the company can sell the bundle together.
Increased confidence in the report means fewer suggestions for bundling with a higher likelihood of sales.
Benefits
The solution offers multiple benefits such as:
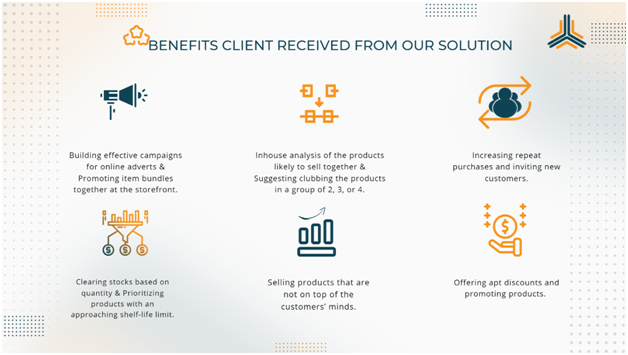
An interesting aspect of the project to note here is that the purpose of this analysis was not to offer bundles when users shop via the app or website. The agenda was to design effective campaigns for mobilizing sales. If 2 products with higher profits are fast-selling items, the model need not club them together because they would anyway sell individually.
Results
Our team completed the complex project in 2 months and delivered reports in 3 phases.
The project proved to be highly effective for the client. They have successfully identified various products that sell together in high numbers. This helped them to bundle the products most profitably and promote both through online campaigns and in the store.
The solution is expected to help them shoot high sales in the coming years. Our client has already started making good revenue with the right adverts and bundling.
The dashboard is compatible with tablets, laptops, and iPads, making it highly accessible. The dashboard also facilitated the client’s marketing team to optimize the stock clearance by prioritizing promotions.
Our client’s team is highly satisfied with the project’s outcome, and their appreciation speaks volumes about our performance.